 Baseball punishes people who prepare in the wrong order.
Most nights start with somebody opening a props page, liking a name, and betting it. What they've skipped is the only thing that reliably decides the night: whether that hitter is batting second or seventh, and what the air is doing to a fly ball at that particular park.
So MLB Tonight is built in the order the night actually happens, not the order a sportsbook app presents it.
Five tabs, and the first one is the one that matters most.
1. Before First Pitch
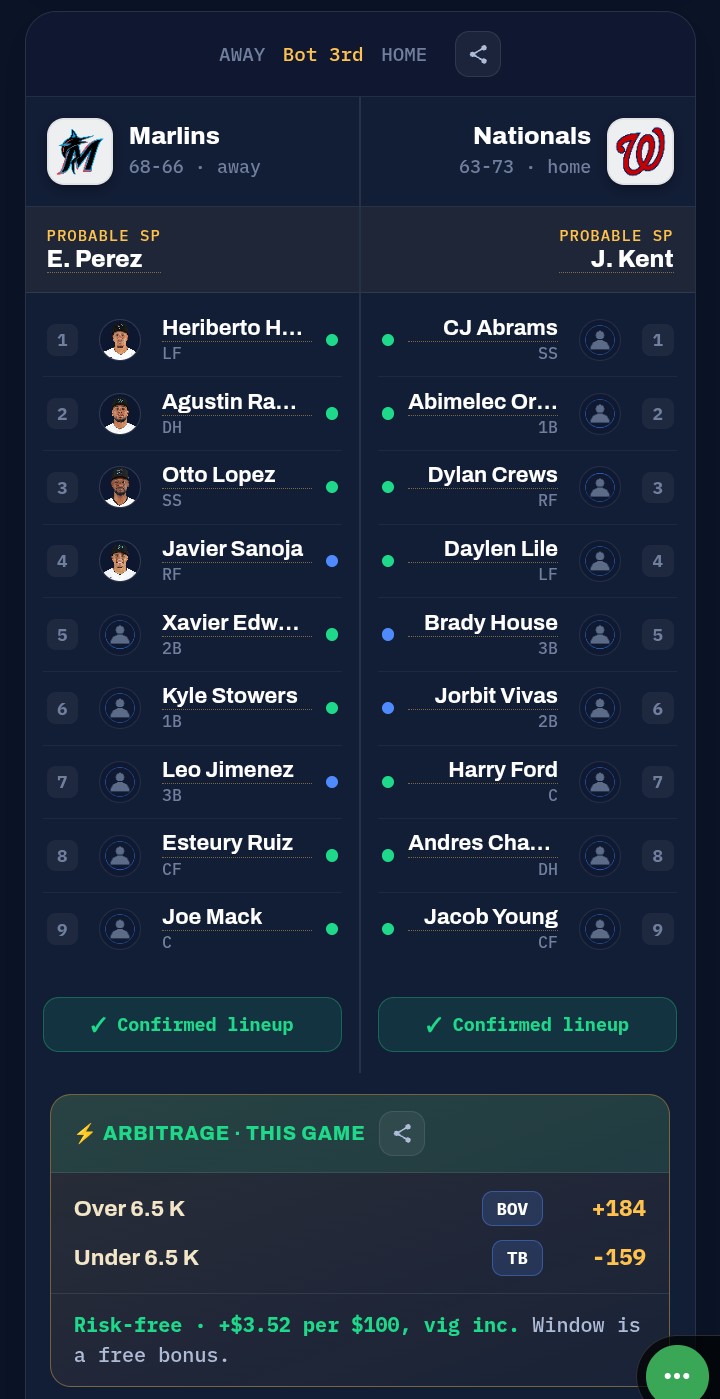
Lineup cards drop roughly two hours before first pitch, and that window is where a projection either becomes useful or becomes worthless.
Batting second is roughly one extra plate appearance over batting seventh. On a total-bases prop that's the entire margin — not a rounding error, the whole thing. A number built on an assumed lineup slot is a guess wearing a decimal point.
Starting Lineups carries today's confirmed cards and probable pitchers — batting order, handedness, and the props posted on each name.
Ballpark Weather is the one nobody checks and everybody should. It measures wind against each park's own orientation — which is the detail that makes it real. Fifteen miles an hour is meaningless as a number; fifteen blowing out to left at a park that already plays short is a different game entirely. Temperature, humidity, roof status and a home run effect for every game.
Batter vs Pitcher overlays any hitter's hot zones against where tonight's pitcher actually lives. Not a career 6-for-19 line — the zones. That's the difference between a coincidence and a reason.
The Bullpen Report tracks usage, rest and availability. A pen that threw three innings last night is the most underpriced thing on a late-inning total, and it's knowable at 4pm.
Plus the player wire for scratches and call-ups, the injury report, live scores and the full schedule.
2. Props And Odds
Fifteen games a night, fourteen markets, two lineups each. That's thousands of individual prices every single evening — and no trading desk prices all of that with equal care. Football has sixteen games a week and every one gets scrutinised. A Tuesday baseball board simply cannot be.
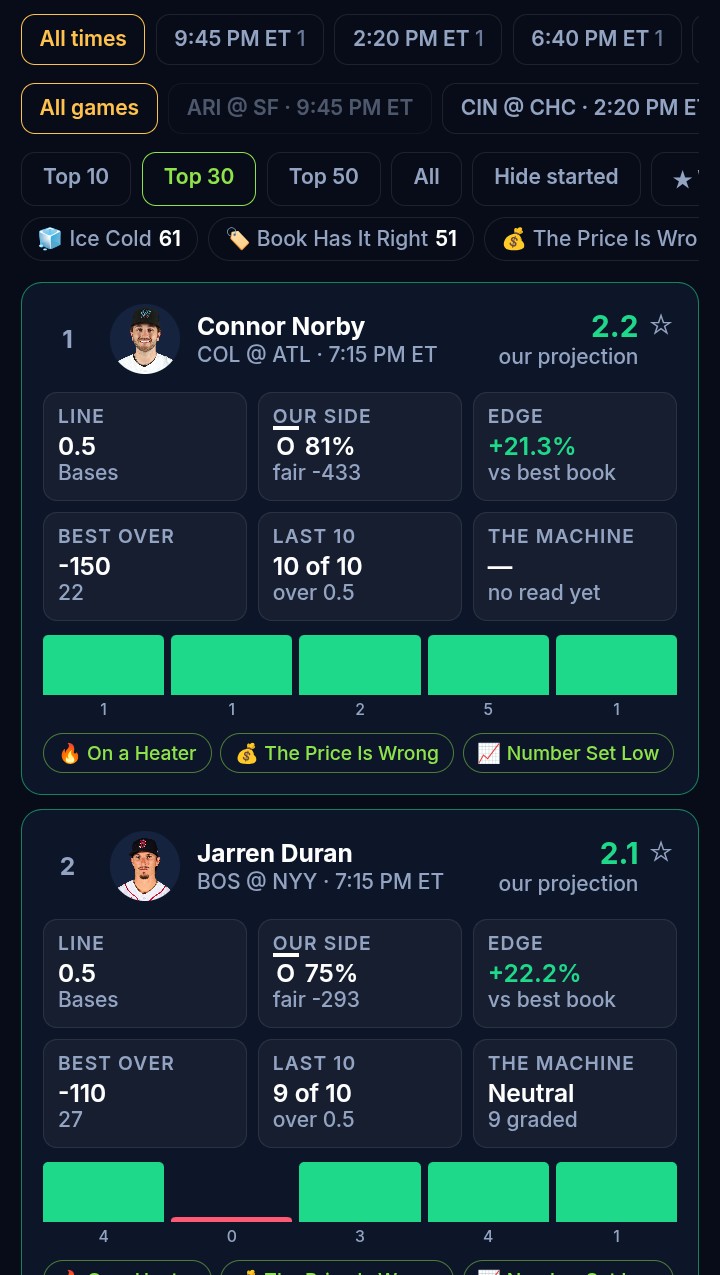
The Projection Board puts our number on every hitter and pitcher next to the best price across nine books, with the edge between them. Hits, total bases, home runs, H+R+RBI, RBIs, runs, walks, steals — plus pitcher strikeouts, earned runs, hits and walks allowed, outs recorded.
The Verdict Slate carries our call on every game — moneyline, run line, total — with the running record beside it. Finals show the call and the grade to everyone.
Then the receipts to check it against: the hit-rate board over the last 5, 10 and 20 in traffic-light colour, the unders board for lines hung above what a hitter is actually producing, and who's genuinely hot off graded results rather than highlights.
Build with the slip builder or the parlay builder, shop it on the heat map, and price it with the Poisson calculator — the correct model for anything arriving as a count, which is most of baseball.
3. Teams And Players
Player cards, all 30 teams, rosters, power rankings, and team streaks — where every run is counted against a line we posted first, which is the difference between a fact and a claim.
Plus the start/sit board and DFS Edge. The season-long MLB hub has scores and standings.
4. Play And Pools
MLB trivia counts on the network leaderboard alongside five other sports. The Gauntlet is survivor played every night across every league in season — and the strategy is genuinely different, because which league you shop in matters more than which team you take.
Everything else is in the Game Room. Buy-ins are counted in sardines; we never hold anybody's money.
5. The Record
And this is the tab I'd point a sceptic at first.
The graded ledger stamps every call the next morning against the number it was locked at — win, loss or push, nothing quietly removed after a bad night.
But the calibration page is the sharper one, and it describes itself better than I can: the least flattering page on the site and the most useful one.
The idea is simple and brutal. A model that says seventy percent should be right about seven times in ten. When it is, it's calibrated and its numbers can be used to size bets. When it isn't, the numbers are decoration.
That page buckets every graded call by the confidence it carried and shows how often those calls actually landed. Which means our honesty is measurable rather than claimed — and it can say something unflattering, which is precisely why it's worth having.
Pair it with the CLV tracker for your own bets. Winning bets can be luck; beating the close is skill.
Why A Separate Page From The MLB Hub
Fair question. The MLB hub is the season-long view — scores, standings, all 30 clubs, where things stand in August.
This is the nightly view. Different question, different urgency. "How is my team doing this year" and "who's in the lineup and what's the wind doing in ninety minutes" are not the same need, and cramming both onto one page serves neither.
The Honest Part
Baseball humbles projections faster than any sport on earth. A great number and a terrible night are entirely compatible, and anybody selling certainty across a fifteen-game slate is selling something.
What this page does is make sure you're looking at the right things in the right order — lineup before projection, weather before total, bullpen before late-inning anything. It won't make a Tuesday certain. It will stop you losing to things that were knowable at four o'clock.
21+. Prices move and lineups drop late — always confirm at the book. 1-800-GAMBLER.