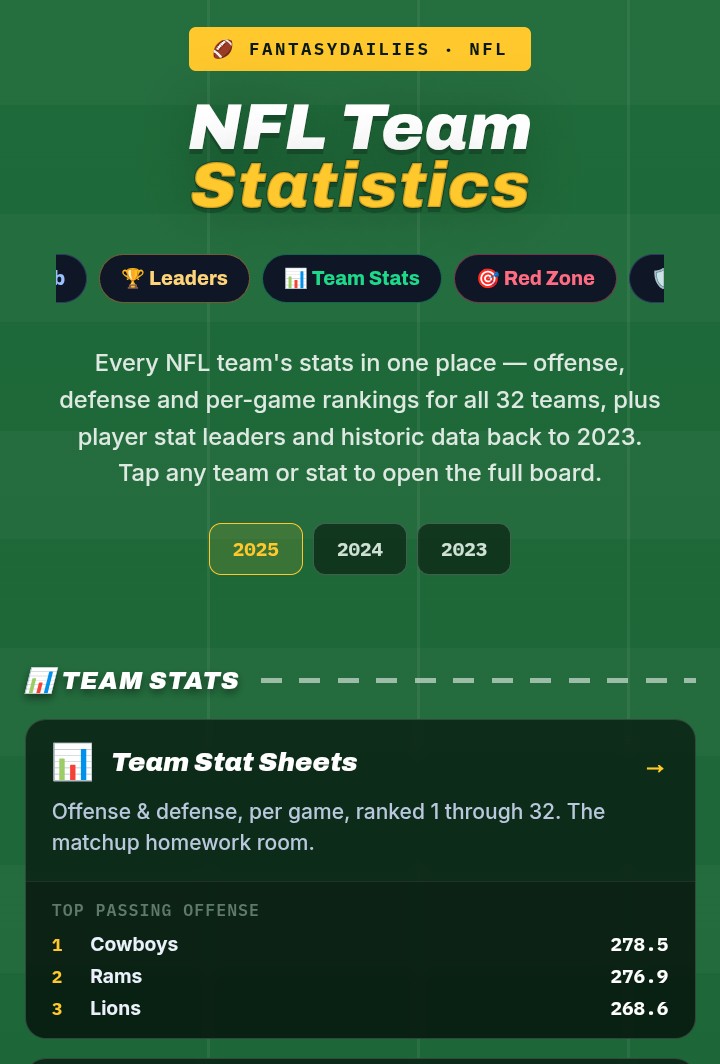
 Most NFL stat sites give you one of two things. Either a wall of raw numbers with no opinion about which matter, or a tidy ranking with no way to check the work underneath it.
The NFL Stats Hub is the index to the whole vault — every board on its own page, every page linkable, everything built from official play-by-play, and three seasons deep because one year tells you what happened and three tells you whether it's who they are.
Here's the whole floor and, more usefully, which board answers which question.
Team Stats — The Matchup Homework Room
Team stat sheets — offense and defense, per game, ranked 1 through 32, with green for league best and red for worst so a full matchup reads in about ten seconds.
Offense — yards, points, third down and red-zone efficiency. The number that does the most fantasy work here is pass rate: it tells you whether a team throws when it's ahead, which is the entire difference between a receiver who vanishes in a 24-point win and one who keeps eating.
Defense — yards and points allowed, sacks, third down, red-zone attempts and touchdowns allowed, turnovers forced.
All three run 2024 and 2023 on their own pages. A defense shredded by tight ends three seasons running has a structural problem it did not fix over the summer; one bad year is often two injuries and a rough month.
Defense vs Position — Because You Never Start A Defense
This is the most important idea in the whole vault, and it's the one most sites get wrong.
Total yards allowed is one number describing four completely different jobs. A unit with elite corners and a slow linebacker corps looks middling overall while being a nightmare for receivers and a buffet for tight ends. The single ranking is actively misleading in both directions.
vs QB — including rushing yards allowed to quarterbacks, the column that separates mobile-QB matchups from everything else. If you stream quarterbacks, start here.
vs RB — receptions and receiving yards split out from rushing. Plenty of defenses stone the run and then hand out seven catches a game out of the backfield. In PPR that's a start-or-sit swing, and total run defense conceals it entirely.
vs WR — the board that settles most flex calls.
vs TE — the most exploitable position in football, because a handful of defenses simply cannot cover the middle of the field and it shows up week after week.
Where The Points Actually Come From
The Red Zone Report runs four boards: touchdowns per trip and trips per game, on both offense and defense.
Splitting volume from efficiency is what makes it useful. Elite trips plus mediocre scoring percentage is an under waiting to happen — they move it, they stall, they kick. A defense with a great TD rate allowed but terrible trips allowed is bending constantly and getting away with it, which is exactly the profile that collapses the week it stops working.
Goal line leaders — inside-5 carries, inside-10 carries, rushing touchdowns and red-zone rush share. This is the board that finds touchdown vultures, and the principle behind it is simple: scores follow usage, and goal-line usage is a job a coaching staff assigns, not a talent a player has.
The Boards Nobody Else Publishes
Explosive plays allowed — 20+ and 40+ yard passes and runs surrendered, ranked fewest-allowed first. So a team at zero gave up none all season, which is the best possible result rather than the worst.
For totals it's the sharpest read on the site. Two defenses can allow identical yardage with opposite profiles — one bleeding six yards a play across twelve-play drives, one holding firm then surrendering two fifty-yard bombs. Only the second wrecks an under, and the yardage column can't tell them apart. For fantasy, read it backwards: a ceiling play wants the units at the bottom.
Turnover stats — differential and takeaways. The most useful idea attached to this board: turnover margin is the least stable "skill" in football. Fumble recoveries are close to a coin flip; interception rates swing violently on identical personnel. Which makes it the best regression signal available — a team at +22 is very likely winning games it won't keep winning, and the market has already priced the record.
Special teams coverage — kick and punt return yards allowed. Nobody builds this board, which is precisely why it's worth having in return-scoring and DFS formats.
Player Leaderboards
The leaders index, plus each board on its own page: rushing, receiving, red zone, kick returns and punt returns.
Red-zone targets is the closest thing fantasy has to a leading indicator. Touchdowns are wildly volatile week to week; red-zone looks are a role. A receiver quietly collecting them is a regression candidate before the scores arrive — and that buy window slams shut the moment they do.
The efficiency boards run a minimum-volume filter, so a man with six carries can't top the yards-per-rush list and fool you in September. That filter is the whole reason those boards are trustworthy.
Player Cards — Everything On One Man
Every player's everything-card: completion zones, run gaps, YAC, snaps, props, form and history.
Josh Allen hit 78% short right last season and 28% deep right — same arm, two different throws. Jahmyr Gibbs went 5.39 to the right edge and 4.23 through left guard, which is a scouting report rather than trivia.
And the number that beats all of it: snap share. Opportunity beats talent every time and it isn't close.
Situation And Conditions
The Mismatch Machine crosses every game against 51 team stat ranks and floats the biggest rank gaps to the top. A #3 rushing offense against a #30 run defense is a gap of 27 — a number rather than a hunch.
Schedule Spots reads rest edges, short weeks, traps and letdowns against 25 years, with the sample size printed on every split and a plain "no edge here" when there isn't one. Every game has its own page carrying the series since 2002.
The Weather Book — 6,511 games joined to hourly stadium conditions, and a split only publishes if it holds over ten-plus games and sits twenty points off that team's own win rate. That test kills the most common fake weather stat: a bad team losing in the cold.
The Surface Book splits every player by turf and grass, sample size attached — and it's knowable in August, because stadiums and schedules are both public.
The Betting Side Of The Vault
ATS trends ranked 1–32 with the rank next to the team, filterable by home, road, favourite, dog, after a win and after a loss. Team streaks for the live runs, every number counted against a line we posted first. Power rankings for where teams actually stand.
Then the Line Checker, the hit-rate board and the unders board.
Why Every Season Gets Its Own Page
Three honest reasons.
You can link it. "The 2024 rushing leaders" is an address you can send, cite or drop in a group chat mid-argument. A dropdown state is not a link.
It loads instantly — each page is pre-built, nothing to compute while you watch a spinner.
And search engines index pages, not dropdown selections. People type "NFL red zone leaders 2025" and it should land somewhere real.
Turn It Into Decisions
Import your team and the Roster Doctor grades every man you own off these exact inputs. Start or Sit for close calls, depth charts and injuries for who's actually playing.
Other leagues have their own vaults: NBA and NHL.
The Honest Part
Historical stats describe what happened, not what will. Rosters turn over, coordinators leave, and a leaderboard from 2023 is a photograph rather than a forecast.
Three seasons exist precisely so you can see which numbers are stable and which were a moment — but the judgement stays yours, and anything that promises otherwise is selling something.
Open the NFL Stats Hub → Every board, every season, free, no account.