 Yardage is the number everybody quotes and the worst one to bet on.
A quarterback throws for 280 yards. Was that 45 attempts at 6.2 a throw, or 28 attempts at ten? Those are completely different players facing completely different props, and the yardage column can't tell them apart.
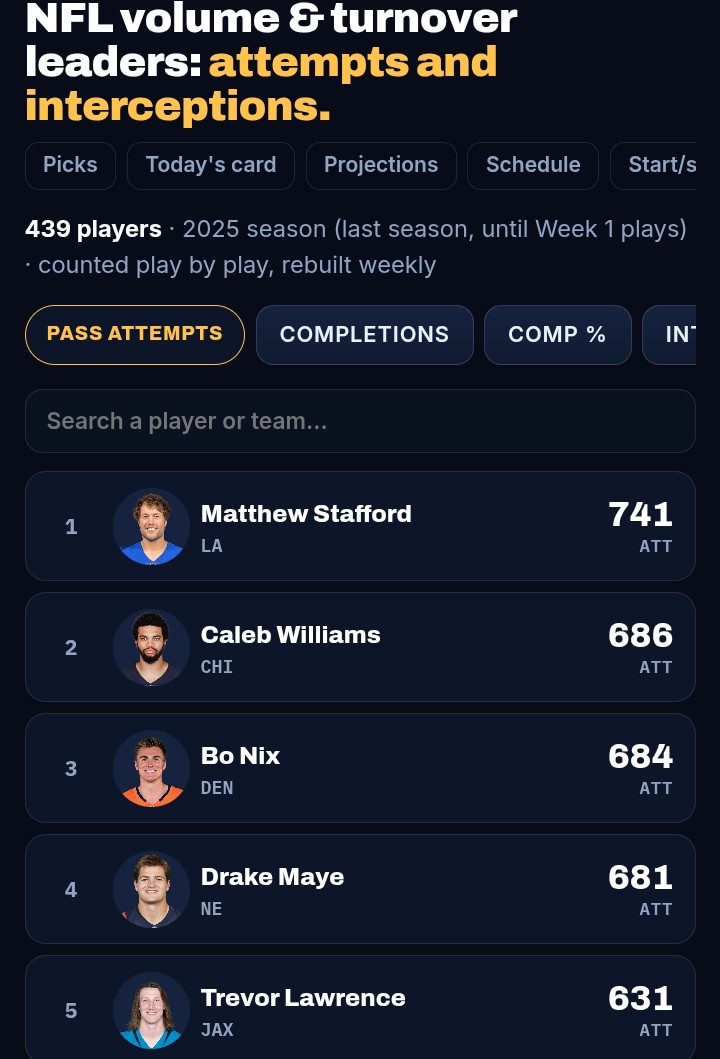
The volume and turnover board carries what's underneath: passing attempts, completions, completion percentage, interceptions, interception rate, rushing attempts and rush success rate — every player, counted from every play.
Counted From Play-By-Play, Not Box Scores
Worth stating because it's the difference between a number you can lean on and one you can't.
These are counted play by play from the official game logs, not scraped from box-score summaries, and rebuilt every Tuesday through the season.
And the rate stats carry a minimum-volume filter — 100 pass attempts or 40 rushes to rank. That filter is the whole reason the efficiency columns are trustworthy. Without it, a backup with nine throws tops the completion percentage board in September and somebody bets on it.
Why Attempts Beat Yards For Props
Every passing prop is a volume question wearing a yardage costume.
Attempts are a role. Yards per attempt is a result. A quarterback on a team that trails and throws 40 times a game has a floor that survives a bad day — he'll accumulate. A quarterback on a run-first team who throws 24 times needs efficiency to clear anything, and efficiency is the volatile part.
Which is why the unders board pairs with this one so well. A passing yards line hung on last month's efficiency, attached to a quarterback whose attempts just dropped because his team started winning, is exactly the shape of a soft over.
Same logic on the ground: rushing attempts is a job a coaching staff assigns, and it's far more stable than yards per carry, which swings on two broken tackles a week.
Interception Rate Is The Regression Signal Nobody Prices
This is the column I'd point at first, and it's on the board for a specific reason.
Interception rate is one of the least stable numbers in football. It swings violently year to year on identical personnel — a tipped ball, a receiver falling down, a defender making a play nobody could plan for. INTs per 100 attempts regresses hard toward the mean.
Which cuts both ways and both are useful:
A quarterback with an ugly interception rate is usually a worse player than his raw INT total suggests he'll keep being. The market has priced the turnovers; the turnovers are unlikely to continue at that rate.
A quarterback with a suspiciously clean one is carrying luck that will run out, and his team's record with it.
Read it beside team turnover stats, because the same principle scales up: turnover margin is the least stable thing in football, and a team riding takeaway luck is a worse bet than its record says. That combination is the cleanest regression read available.
Rush Success Rate — The Column Most Boards Skip
Rush success is the share of carries that gained enough for the down — not yards per carry.
The distinction matters enormously. A back averaging 4.5 a carry on a diet of six-yard gains and two-yard losses is a different asset from one averaging 4.5 with one 60-yard run and a lot of stuffs. The first has a floor. The second is a highlight reel with a bad Tuesday coming.
For fantasy, success rate is a proxy for whether a coaching staff will keep feeding him — because staffs notice the stuffs even when the average looks fine.
How To Actually Use It
Betting a passing prop? Start with attempts here, then the Projection Board for our number against the best price at nine books, and the hit-rate board for how often that line has actually been cleared over the last 5, 10 and 20.
Setting a lineup? Volume tells you the floor. Depth charts tell you whether it holds, the injury report tells you who's playing, and Start or Sit settles the close call.
Looking for the scoring? Attempts get you yardage; goal-line carries get you touchdowns. Those are different jobs and frequently different players — it's why a back gains 1,100 yards and scores four times while a teammate takes eleven.
Checking the matchup? The Mismatch Machine crosses every game against 51 team stat ranks, and the Red Zone Report shows whether an offense even gets down there — a volume role on a team that stalls at the 30 is a stat with nowhere to happen.
The Rest Of The Vault
The NFL hub holds every board back to 2023 — rushing, red zone, explosive plays allowed and the defence-vs-position sheets. Team stats run three seasons deep, because one year tells you what happened and three tell you whether it's who they are.
Conditions nobody checks: the Weather Book joins 6,511 games to hourly stadium weather, and wind wrecks passing volume harder than cold ever does — which is exactly the sort of thing an attempts board makes visible.
And We Call Every Game On It
Every NFL game gets three calls from us — moneyline, spread and total. They stay live all week, lock twenty minutes before kickoff, and get graded the next morning against the number they were locked at, onto the public ledger.
The Week 1 guide has all sixteen, and the calibration page asks the harder question: when we say seventy percent, are we right seven times in ten?
The Honest Part
Volume is descriptive, not predictive. A quarterback who threw 40 times a game because his team trailed all season throws fewer when the defence improves — the attempts were a symptom of the situation, and situations change.
What the board does is stop you reading a yardage total as if it were a role. Attempts are the closest thing to a job description this sport publishes, and jobs move slower than results do.
Open the volume board → Free, no account, rebuilt every Tuesday.