Here's a small, specific frustration that anyone who looks up football stats knows by heart.
You want the 2023 NFL rushing leaders. You find a page. There's a season dropdown. You pick 2023, the table reloads, you get your answer — and then you try to send it to somebody and realise you can't, because the URL never changed. The page you're looking at doesn't have an address.
So we did it the other way round. Every leaderboard, every season, is its own page.
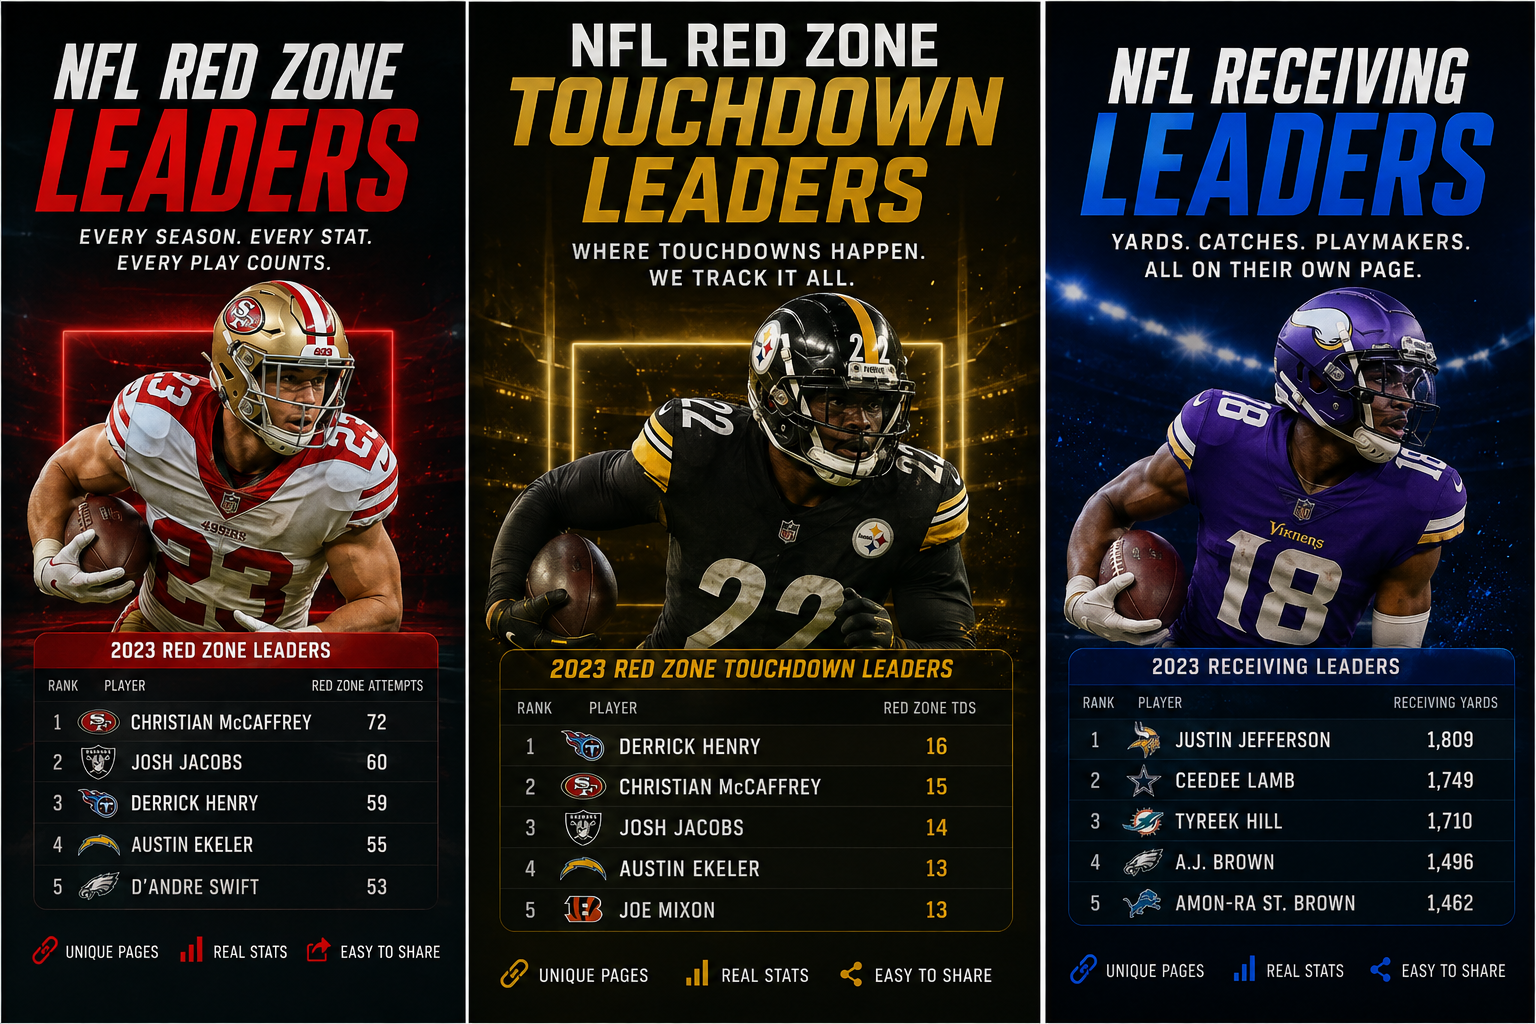
Rushing, receiving, red zone, kick returns, punt returns. Team offense, team defense. Defense against each individual position. 2025, 2024 and 2023, each on its own URL, every one built from official play-by-play.
Twenty-nine pages. It all starts at the NFL stats hub.
The Player Leaderboards
Rushing leaders — 2025 · 2024 · 2023
Receiving leaders — 2025 · 2024 · 2023
Red zone leaders — 2025 · 2024 · 2023
Kick return leaders — 2025 · 2024
Punt return leaders — 2025 · 2024 · 2023
The return boards are the ones nobody bothers building, and that's exactly why they're worth having. Everybody drafts a kicker on autopilot and nobody checks who's actually taking kicks back — in return-scoring leagues that's free points sitting on the table, and in DFS it's a cheap source of ceiling on a punt play.
Why Red Zone Gets Its Own Everything
Yards get you close to the end zone. The red zone is where points actually come from, and it's the difference between an offense that looks good on a stat sheet and one that puts up 31.
The Red Zone Report runs four separate boards, all ranked 1–32:
- Scoring offense — touchdowns per red-zone trip. Elite finishing at the top.
- Trips per game — how often a team even reaches the 20. Volume, before efficiency.
- Red zone defense — touchdown rate allowed inside the 20, stingiest first.
- Trips allowed per game — how often a defense lets you get down there at all.
Splitting volume from efficiency is the whole point, because the combination tells a story neither number tells alone. A team with elite trips and mediocre scoring percentage is an under waiting to happen — they move it, they stall, they kick. A defense with a great TD rate allowed but terrible trips allowed is bending constantly and getting away with it, which is exactly the profile that collapses the week it stops working.
For players, the red-zone leaders are the closest thing fantasy has to a leading indicator. Touchdowns are wildly volatile week to week; red-zone looks are a role. A receiver quietly collecting them is a regression candidate before the scores show up in his box score — and that buy-low window slams shut the moment they do.
Team Sheets, Three Seasons Deep
Three years is the entire point of doing it this way. One season tells you what happened. Three tells you whether it's who they are. A defense shredded by tight ends for three consecutive years did not fix that over the summer — but a single ugly season might have been two injuries and a bad month.
And the position splits, because you never start a defense, you start a position:
- vs QB — including rushing yards allowed to quarterbacks, the column that separates mobile-QB matchups from everything else
- vs RB — receptions and receiving yards split out from rushing. Plenty of defenses stone the run and then hand out seven catches a game out of the backfield, and total run defense hides that completely
- vs WR — the board that settles most flex calls
- vs TE — the most exploitable position in football, because a handful of defenses simply cannot cover the middle of the field
Everything cross-referenced on the combined team sheet, green for league best, red for worst, so a full matchup reads in about ten seconds.
Why Pages Instead Of Dropdowns
Three reasons, and we'll be straight about all of them.
You can link it. "The 2023 receiving leaders" is now an address. You can send it, cite it in an article, or drop it in a group chat mid-argument. A dropdown selection isn't a link and never will be.
It loads instantly. Each page is static and pre-built from play-by-play. Nothing to fetch, nothing to compute while you sit there watching a spinner.
Search engines can index a page and cannot index a dropdown state. "2024 NFL rushing leaders" is a real thing people type, and it should land on a real page rather than a generic one they then have to operate.
What To Actually Do With It
Drafting? Three years of production is how you separate a career year from a baseline — the single most common way people overpay in August. Pair it with the 2026 Draft Guide, the Big Board, Draft Central and the mock simulator. Then the December Board, which grades every ranked player on Weeks 15 through 17 — the only weeks that decide a title.
Setting a lineup? Leaders plus depth charts, injuries and Start or Sit. Or skip the work — import your team from Yahoo, ESPN or Sleeper and let the Roster Doctor grade every man you own and set the optimal lineup.
Betting? The ATS board ranks all 32 against the spread with the rank right next to the team. The Line Checker counts how many times a player has cleared any number you type. The Parlay Doctor grades your slip A through F before you fire it.
Context that never appears in a box score? Turf and grass splits, the Weather Book, Schedule Spots, and the head-to-head book going back to 2002.
One Honest Caveat
Historical stats describe what happened, not what will. Rosters turn over, coordinators leave, and a leaderboard from 2023 is a photograph, not a forecast. The reason we built three seasons instead of one is precisely so you can see which numbers are stable and which were a moment — but the judgement is still yours to make.
Start at the stats hub → All 29 pages free, no signup, built from official play-by-play.