 Here's the difference between the two numbers you're shown before betting a player prop, and it's bigger than it looks.
A projection is an opinion about the future. Somebody built a model, the model says 68.4 receiving yards, and you're invited to trust it.
A hit rate is a record of the past. How many times, in actual games, did this player actually clear this number?
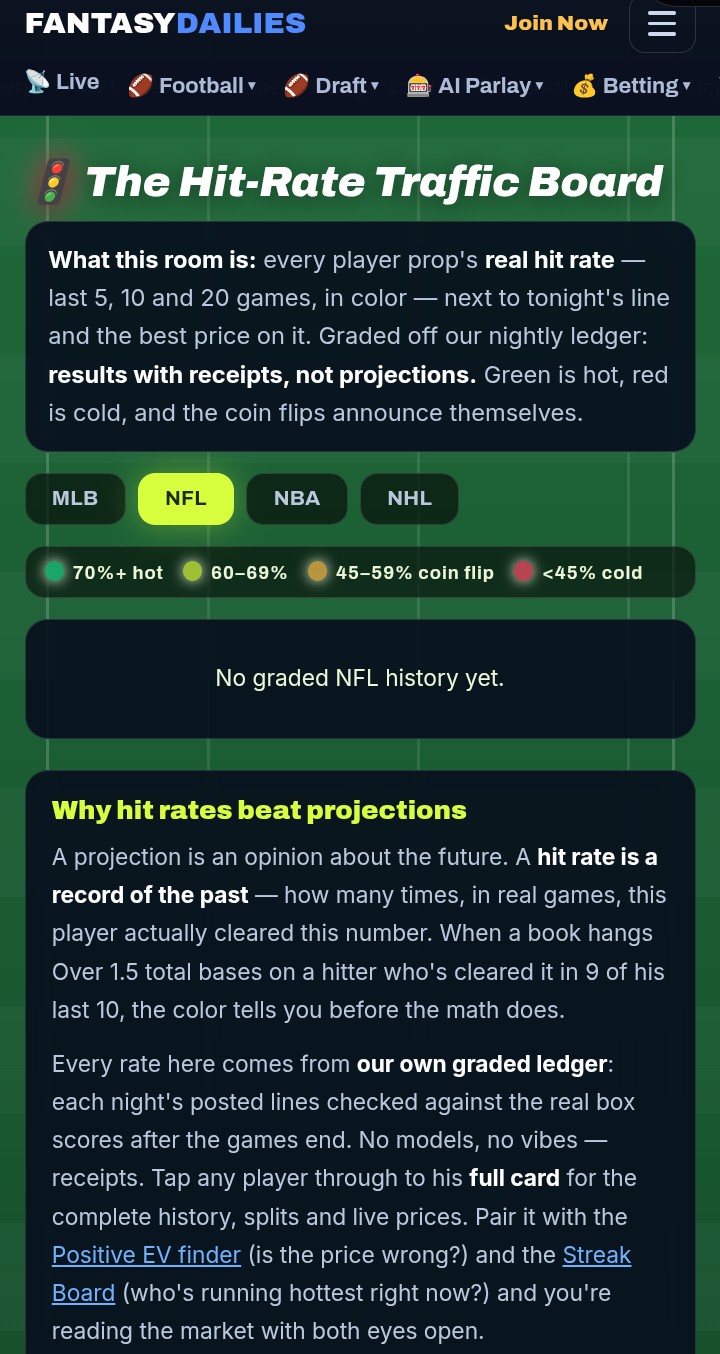
One of those can be checked. The Hit-Rate Traffic Board shows every player prop's real hit rate over the last 5, last 10 and last 20 games, color-coded, sitting right next to tonight's line and the best price on it.
Green is hot. Red is cold. And the coin flips announce themselves in the middle.
The Colors
- 70%+ — hot
- 60–69% — solid
- 45–59% — coin flip
- Under 45% — cold
That middle band is the useful one, honestly. Most props people bet with confidence are sitting in it, and seeing it colored as a coin flip is more informative than any write-up.
When a book hangs Over 1.5 total bases on a hitter who's cleared it in 9 of his last 10, the color tells you before the math does. And when it hangs a number a guy has cleared four times in twenty, that tells you something too.
Graded Off A Ledger, Not A Model
This is the part that makes it trustworthy: every rate comes from our own graded ledger. Each night's posted lines get checked against the real box scores after the games end. No models, no projections, no vibes — receipts.
That's the same discipline behind the graded results page, where every call we make gets stamped the next morning, win or lose, and nothing gets quietly deleted when it goes badly.
It's also why Calibration exists — the page that asks the uncomfortable question about ourselves: when we say something is a 60% shot, does it actually hit 60% of the time?
Why L5, L10 And L20 All Matter
Three windows, because they disagree and the disagreement is the signal.
L5 catches role changes. A back who just took over a backfield, a receiver who moved into the slot, a pitcher on a new plan. Recent form picks it up before anything else does.
L20 catches who a player actually is. Five games is five games — a hot stretch can be entirely noise.
When L5 is green and L20 is red, something changed. That's the most interesting cell on the board, and it's worth investigating rather than betting blind. Check the depth chart and the injury report — usually somebody got hurt or a role moved.
A Worked Example, Because This Is Where People Go Wrong
Say a receiver is priced at Over 64.5 receiving yards, and his last six games read:
110 · 22 · 95 · 18 · 140 · 20
His average is 67.5 yards. Against a 64.5 line that looks like a clear over, and a projection model would tell you exactly that.
He cleared it three times out of six.
That's a coin flip being sold to you as an edge, and the average concealed it completely — because a prop is not an average, it's a threshold. Those are different questions and averaging turns one into the other while destroying the information you needed.
Boom-and-bust players wreck averages. Steady players are undersold by them. That's the entire reason the board exists in color: 50% shows up as a coin flip instead of hiding inside a tidy-looking projection.
Two tools that make the same point from other angles: Boom or Bust shows the shape of a player's range rather than its midpoint, and Consistency tracks how often each player clears his line across markets.
Hit Rate Answers One Question. Price Answers The Other.
A prop that cashes 70% of the time can still be a bad bet if the book has priced it at 75%. Two different questions, two different rooms:
Has it been cashing? — the Hit-Rate Board
Is the price wrong? — the +EV finder, which pulls nine-plus books, strips the vig into a fair line, and flags every book paying past it
Run both and you're reading the market with both eyes open. That's genuinely the whole method, and it's why those two rooms link to each other.
Here's the four-cell version of how the two combine:
- Green rate, price beats fair — the bet you're looking for. Rare, and worth acting on quickly because it usually doesn't last.
- Green rate, price worse than fair — the trap. The market already knows he's hot and has charged you for it. This is where most public money goes.
- Red rate, price beats fair — worth a look. Sometimes the market is overcorrecting on a cold streak, which is exactly when a number gets soft.
- Coin flip, standard price — pass. At -110 you need 52.4% just to break even, and a 50% prop is a slow loss dressed as action.
The supporting math is free too: the devig calculator for no-vig fair odds and the book's hold, the odds converter for the break-even win rate any price demands, and the Kelly calculator for stake size — because a real edge staked badly still goes broke.
The Rooms Next Door
The Line Checker is the manual version and it's worth knowing about: type any number — not a preset, the exact line your book posted — and see how many past games would have cleared it, with the full game log underneath.
The Streak Board shows who's running hottest right now. The props board prices everything across nine books. The heat map puts those books side by side so you never take a worse number. The middle finder catches two books far enough apart that both bets can cash.
Then Check Whether It Repeats
A hit rate is history. Whether it continues depends on things the board can't see:
The Mismatch Machine crosses every game against 51 team stat ranks — a hot prop into a brutal matchup is a different bet than a hot prop into a soft one. The position sheets are underneath it: vs RB with receptions split from rushing, plus vs WR, vs TE and vs QB.
For touchdown props specifically, the goal line board is the one that matters — scores follow inside-5 carries, and inside-5 carries are a job assignment. Cross it with the Red Zone Report for how often that offense even gets down there.
And the context nothing else carries: the Weather Book — wind wrecks passing props harder than anything on the board — plus turf and grass splits and Schedule Spots.
Before You Fire
Build the ticket, then grade it. The Parlay Doctor takes any slip and returns A through F: the true break-even, the buried juice, which legs are correlated, and which single leg is carrying the whole thing. Nothing you paste is stored anywhere.
Correlation is the quiet killer in prop parlays — a quarterback over on passing yards plus his own receiver over on receptions is one event wearing two hats, and books happily price it as though it isn't.
Everything else lives in Parlay Central.
The Honest Part
Hit rates are history and history is not a promise. A player who cleared a number in nine of ten did it against ten specific defenses in ten specific game scripts, and none of that is guaranteed to repeat.
Small windows are the trap. Four out of five is not a trend, it's four games. That's why all three windows are shown together rather than letting you cherry-pick the flattering one — and why tapping through to the full player card is one click away.
Open the Hit-Rate Board → Free, NFL, MLB, NBA and NHL, graded off the nightly ledger.
21+. If it stops being fun, 1-800-GAMBLER.