 Season totals tell you how much a player produced. They don't tell you where — and where is usually the part that predicts next week.
A quarterback with 4,200 yards could be a surgeon on short crossers or a gunslinger living outside the numbers. Those are different players, they beat different defenses, and one of them stops working the moment the wind gets up. The yardage column can't tell them apart.
So every player card on FantasyDailies carries the breakdown underneath the totals.
Quarterbacks: The Six-Zone Completion Chart
The field gets cut into six boxes — short and deep, left, middle and right — and every throw lands in one.
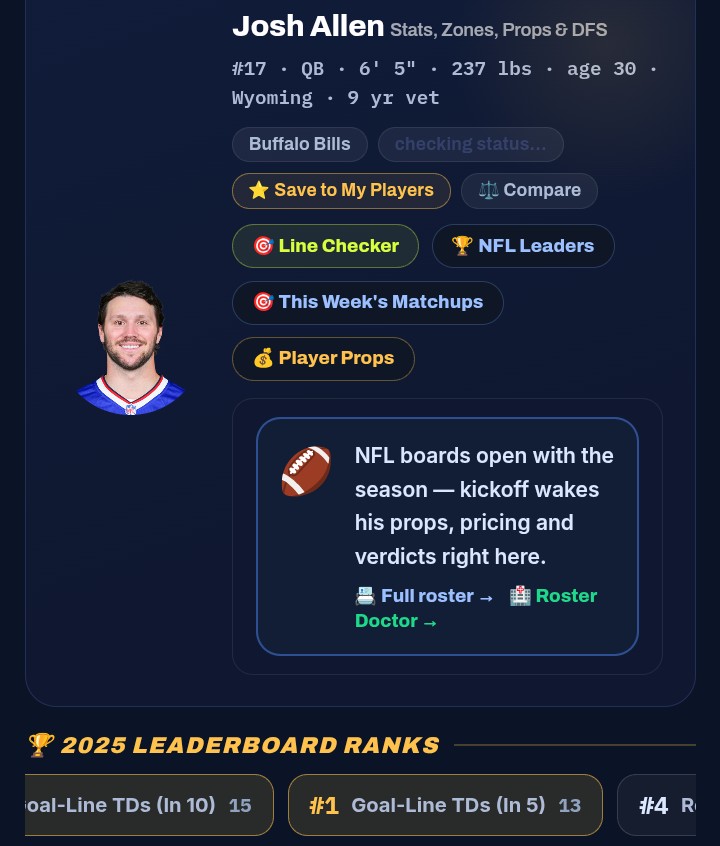
The numbers are frequently startling. Josh Allen hit 78% short right last season and 28% deep right. Same arm, same season, two completely different throws — and a defense that takes away one of them is a very different matchup than one that takes away the other.
This is the read that makes sense of a bad week. A quarterback who lives short-middle against a team with an elite linebacker corps is in trouble in a way his season average will never show you.
Running Backs: Which Gap, And What It Returned
Every carry sorted by the lane he actually ran through — left edge to right edge — with yards per carry and success rate on each one.
Jahmyr Gibbs went 5.39 to the right edge and 4.23 through left guard. That's not trivia, that's a scouting report: he's a stretch-and-bounce back, and his production depends on an offense willing to run him outside.
Put that next to a defense that funnels everything inside and you can see the week coming before it arrives.
Receivers: Target Zones, And The Split That Predicts Survival
Target zones by catch rate, plus the number that matters most when a roster changes: air yards versus yards after catch.
Two receivers can post identical yardage and be entirely different assets. One wins downfield and needs a quarterback who can push it. The other gets schemed into space and would produce for anybody.
Only one of them survives a quarterback change — and that's knowable in advance rather than discovered in Week 6.
Snap Share: The One That Beats All Of It
If you take a single number off a player card, take this one.
Opportunity beats talent, every time, and it isn't close. A player on the field for 90% of snaps has a floor. A player at 40% is a coin flip no matter how gifted he is, because the touches have to find him.
Half of all fantasy busts were guys who were never getting the volume. That's diagnosable in August — not October — and it's the difference between a player being bad and a player never getting the chance to be good.
Same principle runs through every sport we cover. It's minutes in basketball, and shot volume in hockey.
Then Read The Team Around Him
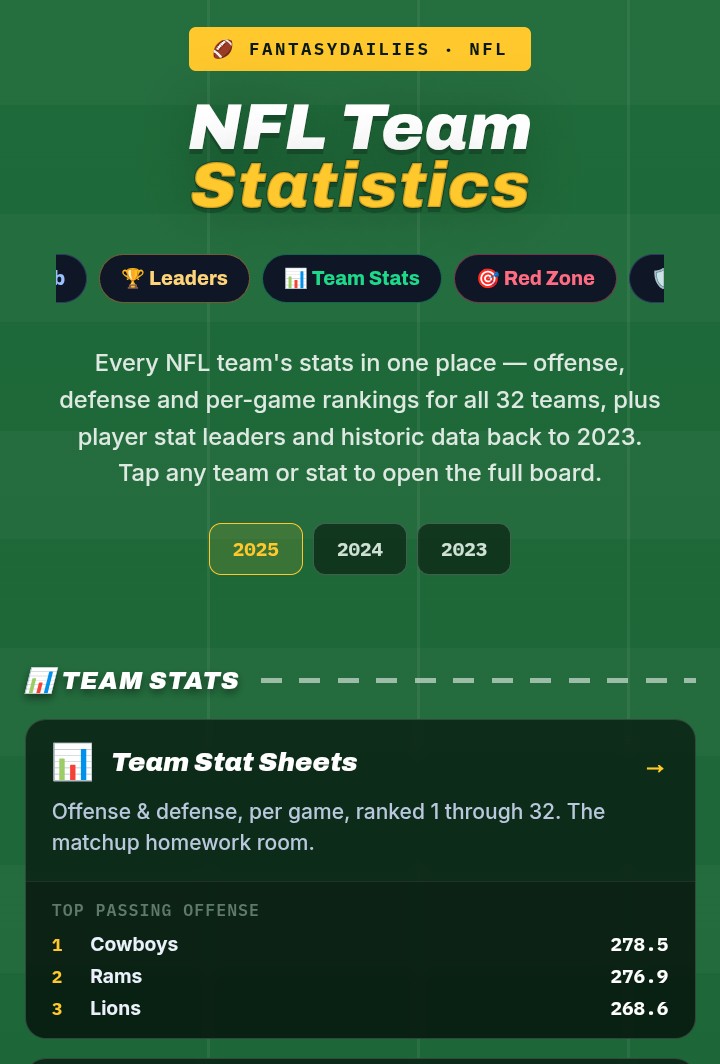
A player card explains the man. The team pages explain the situation — current roster, live depth chart, injuries and the season schedule, with every player linking straight to his own card.
That combination answers the question people actually have: is this a good player in a bad spot, or a bad player who looked good once?
Round it out with depth charts for all 32, the injury report through Sunday inactives, rosters and the player news wire — which carries player items only, no team marketing or ticket promos.
The Boards Behind The Cards
Cards show one man. The leaderboards show where he sits:
Receiving · Rushing · Red zone · Goal line
The goal-line board deserves special mention because it's the one that finds touchdown vultures. Scores follow inside-5 carries, and inside-5 carries are a job a coaching staff assigns, not a talent a player has. It's why a back can gain 1,100 yards and score four times while a teammate you didn't draft takes eleven.
Then the matchup side — you never start a defense, you start a position: vs QB, vs RB, vs WR, vs TE, all three seasons deep.
The Context A Box Score Never Carries
The Surface Book splits every player by turf and grass with the sample size printed. The Weather Book joins 6,511 games to hourly stadium conditions — and wind wrecks passing production harder than cold ever does.
Schedule Spots reads rest edges and traps against 25 years, and every game has its own page with the series record since 2002.
Turn It Into A Lineup
Import your team from Yahoo, ESPN or Sleeper and the Roster Doctor grades every man you own using exactly these inputs. Start or Sit settles two players head to head with the reasoning shown.
Then Boom or Bust for the shape of a range rather than its midpoint, Consistency for who clears his line weekly, and the Mismatch Machine crossing every game against 51 team stat ranks.
Betting the props instead? The Line Checker counts how often he's cleared any number you type, and the hit-rate board shows the last 5, 10 and 20 in colour.
The Honest Part
Zone charts describe what a player has done. Offensive lines change, coordinators get fired, and a back who ran outside all last year can find himself in a gap scheme by September.
A player who changed teams is charted in his old offense — which is exactly why the card is a starting point and the current depth chart is the check.
Look up any player → Free, no account.