"He's got a good matchup in Week 1."
It's the most repeated sentence in fantasy football and almost nobody who says it can tell you what they mean. Press them and you'll usually find they glanced at one number — total yards allowed per game — and made a decision worth actual money on the back of it.
Total yards allowed is one of the least useful numbers in football for setting a lineup. Here's why, in one sentence: you never start a defense. You start a quarterback, a running back, a receiver or a tight end. A defense can be genuinely elite against three of those and a complete catastrophe against the fourth, and the single ranking hides it perfectly.
A real matchup isn't a vibe. A matchup is a collision — between what one team does best and what its opponent defends worst. And a collision is a thing you can measure.
That's what the Mismatch Machine does. Every game on the Week 1 slate, crossed against 51 team stat ranks and the full defense-vs-position sheets, with the biggest rank gaps floating to the top. It rebuilds itself weekly from official play-by-play.
How A Matchup Actually Gets Scored
The Machine doesn't rank teams. It ranks collisions — every meaningful pairing inside every game on the Week 1 slate:
- Rushing offense vs run defense
- Passing offense vs pass defense
- Each receiving room against the defense-vs-position sheets — yards allowed per game to wide receivers, tight ends, running backs and quarterbacks
- Red zone offense against red zone defense
- Explosive-play rate against the defenses that surrender chunk plays
The score is the rank gap. A #3 rushing offense meeting a #30 run defense produces a gap of 27. That's not an opinion or a hunch — it's a number, and it's the kind of number start/sit calls, DFS lineups and prop bets are actually built on.
This is the part that makes it usable at 11:45 on a Sunday morning in September. "Good matchup" is unfalsifiable. "The third-best rushing attack in football is playing the thirtieth-best run defense" makes the decision for you.
Every chip on the board links back to the full stat sheet it came from, so you're never taking the Machine's word for anything — and every game links to its matchup page with the series history since 2002.
What The Board Is Reading In Week 1
Worth stating plainly, because most sites are vague about it: there is no 2026 data yet. Nobody has played a snap that counts, and we do not build anything off preseason — preseason football is starters playing twelve snaps against backups, and treating it as evidence is how people talk themselves into bad Week 1 lineups.
So until Week 3 of 2026, the board reads final 2025 numbers, clearly stamped on the page so you always know what you are looking at. After that it follows the live season.
That is the honest way to run it. Last season's finished, verified numbers are a far better guide to Week 1 than three quarters of August football, and pretending otherwise would just be dressing up noise.
Why Position Splits Beat Total Defense Every Time
This deserves its own section because it is the flaw underneath most bad matchup takes you will hear all season.
Total yards allowed is a single number describing four completely different jobs. Consider a defense with two excellent corners and a slow linebacker corps. Overall, it looks middling — maybe 16th. In reality it's a nightmare for wide receivers and an all-you-can-eat buffet for tight ends and pass-catching backs. That one ranking is actively misleading in both directions.
The position sheets don't average that away. And they run three full seasons deep — 2025, 2024 and 2023 — which is the thing that separates a genuine defensive identity from one weird year. A unit shredded by tight ends for three consecutive seasons has a structural problem it did not solve over the summer. A single ugly season might have been two injuries and a bad month.
Two columns almost nobody else breaks out, and both decide lineups:
Rushing yards allowed to quarterbacks. Mobile QBs are a fantasy cheat code precisely because containing a scramble is a completely separate skill from covering a pass. Some defenses are excellent at one and helpless at the other, and if you're streaming quarterbacks this is the first column you should look at.
Receptions allowed to running backs, split out from rushing yards. Plenty of defenses stone the run and then hand out seven catches a game to backs. In PPR that's the entire difference between a fade and a start — and total run defense conceals it completely. This one column has probably cost more people more points than any other blind spot in fantasy.
Where The Points Actually Come From
The Machine reads red zone and explosive plays because those two categories decide games in ways that raw yardage never captures.
Red zone: volume and efficiency are different questions
The Red Zone Report runs four separate boards — touchdowns per trip and trips per game, on both offense and defense, all ranked 1 through 32.
Splitting volume from efficiency is what makes it worth reading. The combination tells a story neither number tells alone:
- Elite trips, mediocre scoring percentage — an under waiting to happen. They move the ball, they stall inside the 20, they kick. Great for a kicker, poor for everyone else in that huddle.
- Few trips, elite scoring percentage — a team that lives on efficiency, which is far less stable than volume and tends to regress.
- Great TD rate allowed, terrible trips allowed — a defense bending constantly and getting away with it. That profile collapses the week it stops working.
Explosive plays: the ceiling stat
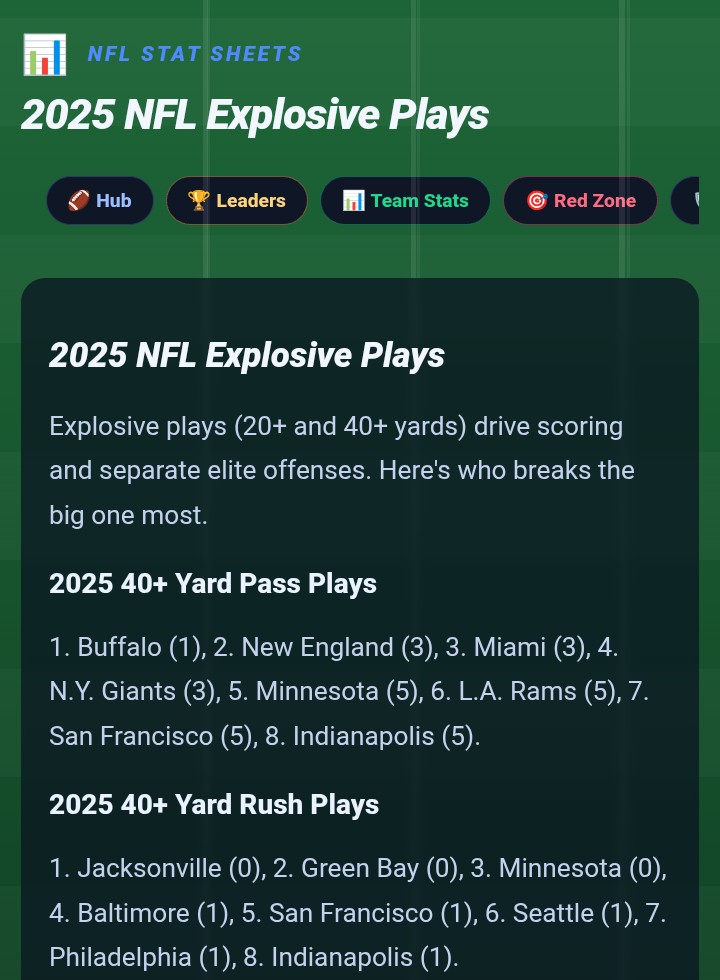
The explosive plays board tracks 20+ and 40+ yard gains through the air and on the ground, all 32 ranked, with 2024 and 2023 on their own pages.
Consistency wins you weeks. Explosive plays win you playoff matchups. It's the difference between the player who reliably gets you 14 and the one who occasionally gets you 34 — and in a single-elimination fantasy semifinal, only one of those actually saves your season.
For totals betting it's a cleaner signal than yards per game. Two offenses can gain identical yardage with completely different scoring profiles: one grinding out twelve-play drives that stall at the 22, one hitting a pair of 50-yard bombs. Only one of them cashes an over.
Goal line: the touchdown story nobody reads
New and immediately useful: the goal-line leaders board — inside-5 carries, inside-10 carries, rushing touchdowns and red-zone rush share for every back in football.
In 2025, Derrick Henry led the league with 27 carries inside the five, followed by Josh Jacobs at 22, Christian McCaffrey at 21, Ke'Shawn Williams at 20 and Zach Charbonnet at 19. That list is the single best resource on the internet for anytime-touchdown props, and it's the page that identifies the vulture on your own roster before he ruins a season.
Three Ways To Use The Board
1. Start/sit
Week 1, you've got two flex options and genuinely can't separate them. Check which one is walking into the bigger collision — that's your tiebreaker, and it costs you ten seconds. Then settle it properly with Start or Sit, which compares any two players on matchup, volume and recent form with the reasoning shown rather than a black-box number.
Cross-check the shape of the player while you're there: Boom or Bust for the range, Consistency for who actually clears his line week to week, and Hot and Cold for direction.
2. DFS
Mismatches are where leverage lives, because the field drafts names and reacts to preseason noise rather than the collision in front of it. A big rank gap on a moderately priced player is exactly the shape of a tournament-winning roster.
Pair it with DFS Edge for salary value, the AI optimizer to solve the cap off real DraftKings salaries, and the Contest Lab for the bankroll math almost nobody bothers doing.
3. Player props
A big rank gap plus a soft number is the cleanest angle in prop betting, full stop.
The Line Checker tells you exactly how many times a player has cleared any number you type, with the full game log printed underneath as receipts — because a prop is a threshold question, not an average, and averages hide boom-bust players completely.
Then shop it on the props board across nine books, and grade whatever you build with the Parlay Doctor, which flags the correlated legs that quietly kill tickets. Everything else is in Parlay Central, and every call we make gets stamped the next morning in the graded ledger, win or lose.
What The Machine Can't See
Three things it doesn't know. You should.
Who's actually playing. A perfect collision is worth precisely nothing if the guy is inactive, or splitting work with a rookie who looked good in camp. Check depth charts for all 32 teams and the injury report through Sunday inactives. Half of all fantasy busts were never getting the touches — and that is diagnosable before kickoff, not after.
The conditions. A mismatch in a dome and the same mismatch in a 25 mph crosswind are different bets. The Weather Book holds 6,511 games joined to the hourly weather at the stadium, and only publishes a split if it survives ten-plus games and sits twenty points off that team's own win rate. The Surface Book splits every player's production by turf and grass with the sample size attached.
The situation. Rest edges, short weeks, letdowns after a war, lookahead traps before a marquee game. Schedule Spots judges every game against 25 years of history — and every matchup now has its own page with the full series record since 2002 and the average combined score.
And the caveat we print on everything: rank gaps describe what has happened, not what will. Coordinators get fired, corners come back healthy, offensive lines change. It's the strongest tiebreaker on the site. It is not a guarantee, and anyone selling you certainty in September is selling you something.
Where To Start
Open the Mismatch Machine → Free, no signup, rebuilt every week of the season from official numbers.
Then work outward: the NFL stats hub for every board and every season, turnover stats for the regression signal nobody prices, and power rankings for where teams genuinely stand.
Fastest version of all of it: import your team from Yahoo, ESPN or Sleeper and let the Roster Doctor grade every man you own and build the optimal lineup out of your actual roster. Everything lives in the NFL Fantasy & DFS Hub.