Every fantasy site on the internet publishes rushing yards. Almost none of them publish who is actually getting the ball inside the five.
That gap is where seasons quietly get decided. You can watch your back rack up 1,200 yards and four touchdowns while a 245-pound teammate you'd never heard of in August vultures eleven scores from the goal line — and no standard leaderboard anywhere will show you that pattern forming until it has already cost you the season.
So we built the boards for the stats that actually decide things rather than the ones that are easy to find. Twelve new pages, four categories, three seasons each, every one built from official play-by-play.
1. Goal Line Leaders: Find The Vulture Before He Finds You
This is the board that should change how you draft running backs, and it's the one I'd point a new user at first.
It breaks out inside-5 carries, inside-10 carries, rushing touchdowns, and each back's share of his team's red-zone rushing — for every back in football.
Here's the 2025 top of the board for carries inside the five:
- Derrick Henry (BAL) — 27 carries
- Josh Jacobs (GB) — 22
- Christian McCaffrey (SF) — 21
- Ke'Shawn Williams (CIN) — 20
- Zach Charbonnet (SEA) — 19
- James Cook (BUF)
Look at that list carefully, because it makes the point better than any explanation can. Two of those names are unambiguous first-round fantasy picks. The others are a mix of committee backs and pure touchdown vultures — and in a league where a rushing touchdown is worth six points, twenty carries from the one-yard line is a fundamentally different asset than 900 yards between the twenties.
Why touchdown usage beats touchdown totals
Touchdowns are the most volatile thing in fantasy scoring and simultaneously the most valuable. But they are not random — they follow usage, and goal-line usage is a role a coaching staff assigns, not a talent a player has.
That distinction is worth real money on draft day:
- A back with a 70% red-zone rush share has a touchdown floor. The offense doesn't have to be good; it just has to get down there.
- A back with elite total yardage and a 20% share is one signing away from being a boring flex play.
- A back who scored twelve touchdowns on a low share got lucky, and you'll pay full price for that luck in August.
- A back who scored six on a huge share is underpriced, and that's the profile you want.
The best anytime-touchdown prop resource on the site
For bettors this board is the starting point for the entire touchdown-scorer market. The workflow:
- Who owns the goal line — this board
- How often his offense gets there — the Red Zone Report, trips per game
- Whether the defense bends inside the 20 — same page, defense side
- How the opponent handles backs specifically — defense vs RB, with receptions split out from rushing
- Shop the number — the props board, nine books
- Grade the ticket — the Parlay Doctor
2. Explosive Plays: Where Ceilings Come From
20+ and 40+ yard gains, through the air and on the ground, all 32 teams ranked.
Consistency wins you weeks. Explosive plays win you playoff matchups. That's the whole case, and it's the difference between the player who reliably hands you 14 points and the one who occasionally hands you 34 — in a single-elimination fantasy semifinal, only one of those actually saves your season.
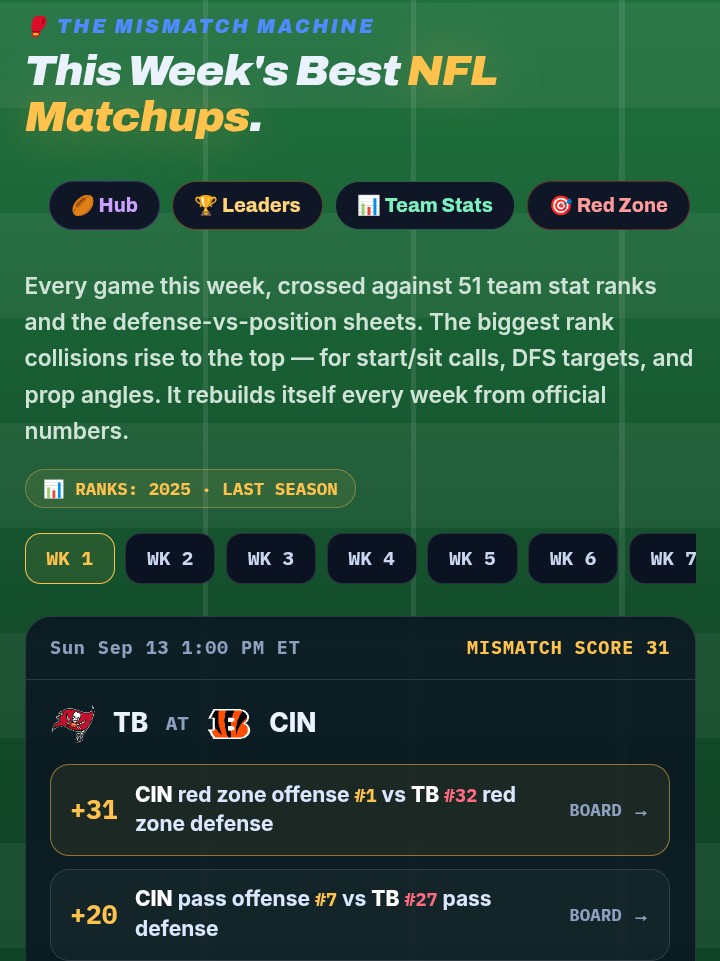
For DFS this is the leverage stat. In a tournament you don't need a safe 14; you need the outcome that breaks the slate. An explosive offense meeting a defense that surrenders chunk plays is the single highest-ceiling collision on any board — and the Mismatch Machine reads exactly that pairing when it crosses every game against 51 stat ranks.
For totals, explosive rate is a cleaner read than yards per game. Two offenses can gain identical yardage with completely opposite scoring profiles: one grinding out twelve-play drives that stall at the 22, one hitting a pair of 50-yard bombs and going home. Only one of those cashes an over, and the yardage column can't tell you which.
3. Turnover Stats: The Regression Signal Nobody Prices
Turnover differential, takeaways and giveaways, all 32 ranked. The 2025 board:
Differential: Chicago +22, Houston +17, Jacksonville +13, Pittsburgh +12, L.A. Rams +11.
Takeaways: Chicago 33, Jacksonville 31, Houston 29, Pittsburgh 27, Seattle 26.
Now here's why this board matters more than it looks, and it's the most useful idea in this article:
Turnover differential is the most unstable "skill" in football. Fumble recoveries are close to a coin flip — the ball is oblong and it bounces where it wants. Interception rates swing violently year to year on identical personnel. A defense doesn't "become" a takeaway defense the way it becomes a good run defense.
Which makes turnover margin the best regression signal available to anyone paying attention:
- A team sitting at +22 is very likely winning games it will not keep winning. The market has already priced its record, and the thing producing that record is not repeatable.
- A team at −11 has probably been better than its record and is about to get cheaper than it should be. That's where value hides in October.
That feeds directly into the ATS board — where a good cover record means underpriced, not good — and into the power rankings.
For fantasy it moves game script, which people underrate. A defense generating takeaways hands its own offense short fields and extra possessions. More snaps, better starting position, more red-zone trips — every skill player in that huddle benefits, and none of it shows up in a target share.
4. Special Teams Coverage: The Free Points
Kick return yards allowed per game and punt return yards allowed per game, all 32 ranked.
The 2025 spread is wider than you'd guess. The L.A. Rams allowed 49.29 kick return yards per game; Tennessee, second, allowed 70.41 — a gap of more than twenty yards a game between first and second. On punts, Dallas allowed 4.82 yards per game against Green Bay's 8.71.
Nobody builds this board, which is exactly why it's worth having. In return-scoring leagues and DFS it's real points, and in any league scoring team defense, coverage units are a meaningful chunk of the weekly total that literally nobody in your league is researching.
Pair it with the return leaders — kick and punt — and you have both sides of a matchup most people don't know exists.
Why Every Board Goes Back Three Seasons
One year tells you what happened. Three tells you whether it's who they are.
That distinction is the entire reason these pages run back to 2023, and it matters most on exactly the volatile categories above. A defense shredded on explosive plays for three consecutive seasons has a structural problem it did not fix over the summer. A single ugly year might have been two injuries and a bad month — and the market frequently can't tell the difference either, which is precisely where the edge lives.
Turnover differential is the clearest case: three years of data makes it obvious which defenses genuinely generate takeaways and which just had a lucky October that everyone mistook for an identity.
How It All Connects
Everything starts at the NFL stats hub — every board, every season, each on its own page so you can actually link it and send it.
Team context: combined sheets, offense, defense, plus the position splits that decide lineups — vs QB (including rushing yards allowed to quarterbacks), vs RB, vs WR, vs TE.
Player boards: rushing, receiving, red zone, and the full leaders index.
Context a box score never carries: turf and grass splits, the Weather Book, Schedule Spots, and head-to-head since 2002.
Then go act on it: Start or Sit for the close calls, import your roster so the Roster Doctor grades your actual team, the December Board if you're still drafting, the Survivor Solver if you're in a pool, or the Line Checker and the Parlay Doctor if you're building a ticket.
Start at the hub → All free, no signup, built from official play-by-play.