FantasyDailies | NHL | Tuesday, November 3, 2026 |  Avalanche at
 Blue Jackets, 7:00 PM ET
For a long time I read hockey previews the same way I read a weather report. Somebody tells me a team is favored, I nod, and I forget about it until the final score shows up. What changed that for me was a game simulator, and not because it told me who would win. It changed how I look at a single matchup, and what I think a number on a screen actually means.
Here is the basic idea. A simulator takes a game that hasn't been played yet and plays it over and over in software. Each run is a little different, the same way two real games between the same teams are never identical. Do that enough times and you stop looking at one outcome and start looking at a spread of them: how often each side wins, which scores come up most, and how wide the range of results is.
The example I keep coming back to is tonight's Colorado Avalanche at Columbus Blue Jackets game, 7:00 PM ET at Nationwide Arena, which FantasyDailies runs through its AI NHL game simulator. The page plays the matchup 10,000 times. Across those runs, Colorado wins 71% of the time and Columbus wins 29%. The typical final is 5-3. The inputs are printed right on the page: a total of 6.5 and a puck line of +1.5.
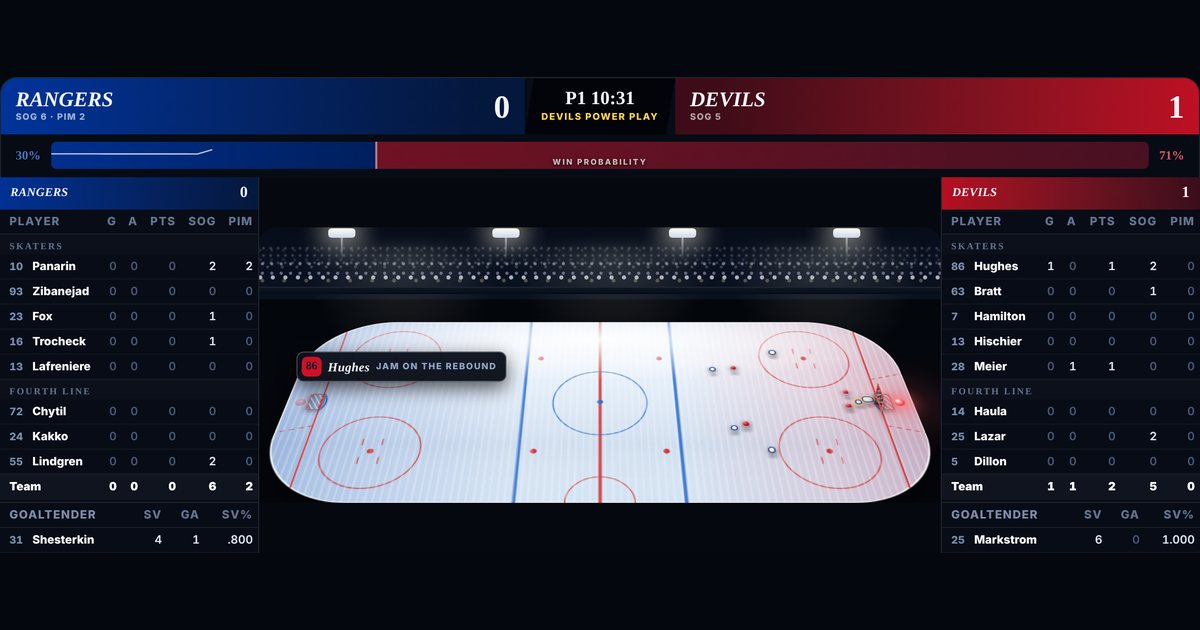
Watch it: Avalanche at Blue Jackets, played 10,000 times
Tap Play to watch the game unfold. Trouble viewing? Open the simulator full screen.
The middle, not the highlight
The first thing I had to learn was what "typical" means. That 5-3 isn't the most exciting run or the luckiest one. The page describes it as the score in the middle of all 10,000 runs. That matters because it's tempting to latch on to the dramatic stuff. One wild run out of thousands tells you almost nothing on its own. The middle tells you where most of the results bunched up.
The second thing was keeping 71% in its place. A 71% chance is strong, but it also means that in roughly three of every ten runs, the Blue Jackets win. That isn't a rounding error. It's a real share of the outcomes. Reading it as "Colorado wins tonight" throws away the most useful part of the number, which is how much room is left for the other side.
One game, played out in full
The part that hooked me is that the page also plays back a single full game, period by period, with a box score that updates as it goes. In the playback on the page, Columbus led 2-1 after the first period on goals from Charlie Coyle and Danton Heinen. Then the Avalanche scored three straight, from Nathan MacKinnon, Jaden Schwartz and Nazem Kadri. Cole Sillinger pulled Columbus within 4-3 in the third, and Brock Nelson made it 5-3. MacKinnon finished with a goal and an assist, Mackenzie Blackwood made 22 saves, and Adam Fantilli had three assists for Columbus.
It's easy to watch that and think you've seen the future. The page says otherwise. The goals are arranged into one way that final score could have happened. They are not a forecast of any single play or of any player's stat line. So if you take that playback and decide Fantilli is going to get three assists tonight, you've read it wrong. What the playback is good for is making the numbers feel real: you see how a 5-3 game might unfold, including a stretch where the underdog is ahead.
The win probability bar
Across the top of the playback there's a win probability bar that moves as the game goes. According to the page, that number comes from the score, the time left, and how far real final scores have landed from what the site's numbers expected in games it has already finished. Watching it swing when Columbus went up 2-1 was a good lesson. A lead early in a hockey game moves the needle, but it doesn't erase the starting picture.
What the model leaves out
This is the part I'd tell anyone to check before they trust a simulation. The page lists its assumptions. In the simulation, everybody plays. There are no injuries, suspensions, trades, coaching changes or travel. If a top player is scratched or a backup goalie starts, the simulation doesn't know that. Part of using a tool like this well is checking the news yourself and asking how much a late change would shift things.
Tonight is a good example. Colorado played last night and beat the  Blackhawks 5-2 at the United Center (box score), so this is the back half of a back-to-back with a trip from Chicago to Columbus in between, which is exactly the kind of travel the simulation ignores. On our NHL injury report, Colorado lists two players: defenseman Josh Manson is out and Zachary L'Heureux is on injured reserve. Columbus has nobody listed. The goalies aren't confirmed either, so check before puck drop.
How I use it now
These days I treat a sim page as a starting point for research, not an answer. I look at the win split and ask how wide it is. I compare the typical score with the total to see whether the run lands above or below the number. I watch the playback to get a feel for how the game could go, and then I set it aside. Then I go check injuries and goalie news, because that's exactly what the model says it ignores.
The simulator isn't the site's opinion, either. The page says so itself: our call on this game is set separately, and if the simulation disagrees with it, the call stands.
Everything for Avalanche at Blue Jackets
- Avalanche at Blue Jackets game simulator: run it 10,000 times and watch the playback.
- Our call: NHL verdicts page.
- Live and final: the box score for this game, and the whole slate in the NHL Game Zone.
- Injuries and goalies: the NHL injury report.
- Building something: the NHL Parlay Builder, the NHL Slip Builder or the AI Parlay Generator.
- Watch FantasyDailies TV on Roku and Amazon Fire TV.
None of this predicts a result. Ten thousand runs give you a better sense of the range, and the actual game will still be played on the ice.
Research, not a pick. 21+ | Gambling problem? Call 1-800-GAMBLER