Go look up any NFL team's against-the-spread record right now. You'll find the record in about four seconds.
Now answer the only question that actually matters: is that good?
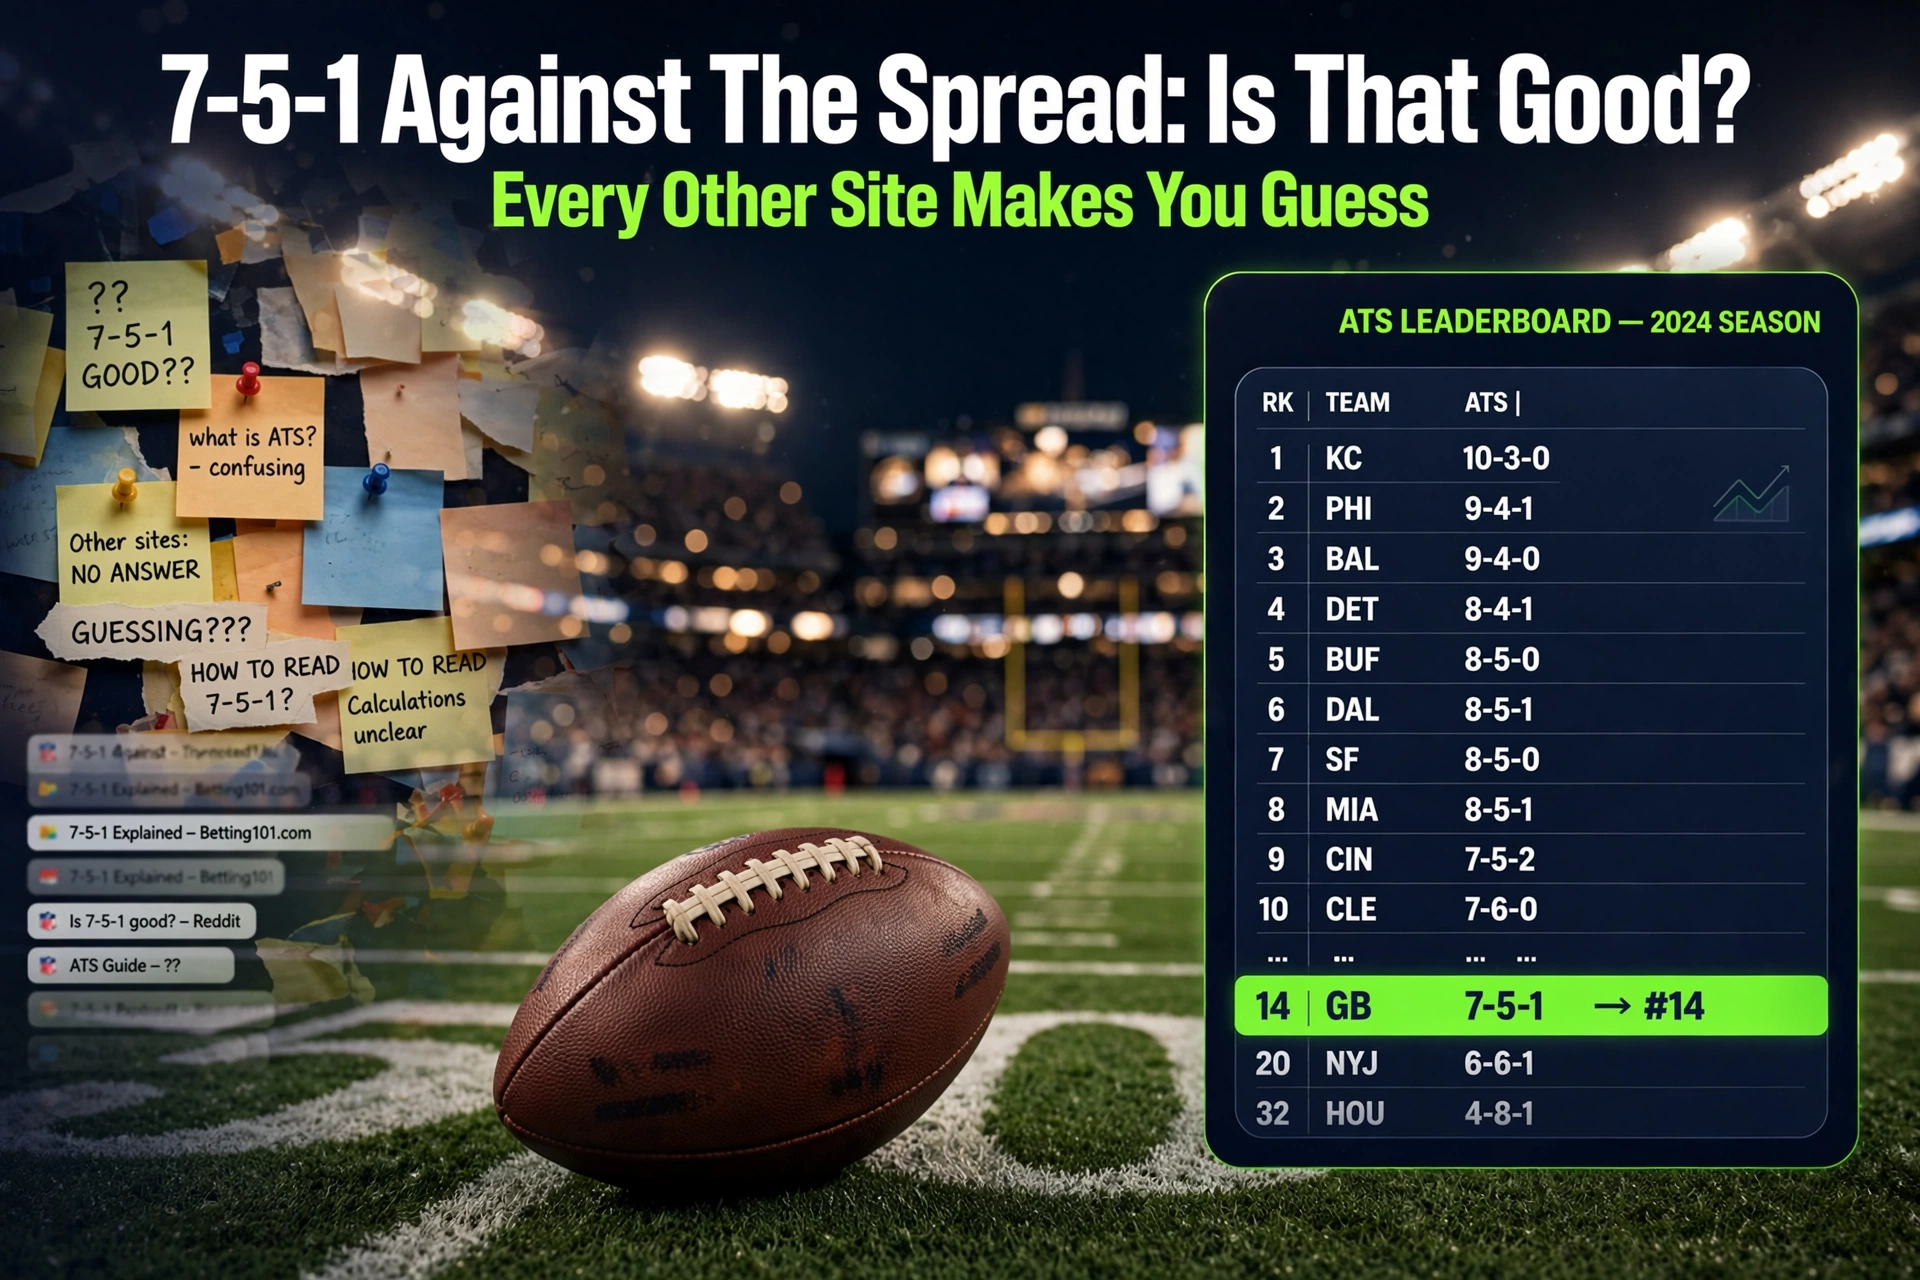
7-5-1 ATS. Is that eighth in the league or twenty-first? Suddenly you're opening 32 tabs, writing numbers on the back of an envelope, and doing arithmetic that the site could have done for you before you arrived.
That's the entire reason our ATS board exists in the shape it does. Every team ranked 1 through 32, ordered best to worst, with the rank number sitting right next to the team. No arithmetic. No tabs.
Three Boards, Because They Answer Different Questions
Against the spread. Cover records, ranked. Pushes are reported as pushes and excluded from cover percentage — which sounds like a technicality until you realise that counting pushes as anything else quietly inflates every team's number on half the sites you've read.
Over/under. How each team's games land against the total. This is the board almost nobody checks and it's frequently the most useful one, because situational factors — wind, pace, a defense that can't get off the field — show up in totals before they show up anywhere else.
Straight up. Plain wins and losses, for when you want to know who's actually good rather than who's been priced correctly. Those are different questions and keeping them on separate boards keeps them from getting confused.
All of it is built from official closing lines and results. A push or a missing line doesn't count against a team, which matters more than it sounds — sloppy ATS data quietly punishes teams for games that were never properly priced.
Filter It The Way Sharps Actually Do
A season-long ATS record is a blunt instrument. Nobody serious bets off it. The entire art is in the splits, and the board carries all of them:
Home and road. Some teams are a genuinely different proposition away from home, and the market does not always adjust far enough. Road performance is one of the most persistent, least-priced splits in football.
As a favorite and as a dog. This is the big one, and it's the split most people never look at. Covering a big number is a completely different skill from winning a football game. Plenty of teams are excellent underdogs and abysmal favorites — they play their best when nobody expects it and then get laid on a hook and lay an egg. Same roster, same coach, two completely different betting propositions.
After a win and after a loss. The bounce-back and the letdown, measured instead of assumed. Everyone on television talks about a team "responding" — this is where you find out whether that team actually does.
That last split pairs directly with Schedule Spots, which judges rest edges, short weeks, traps and letdowns against 25 years of games, prints the sample size on every split, and says "no edge here" instead of manufacturing one to keep you clicking.
The Thing Most People Get Backwards
Read this part twice, because it's where ATS records cost people money.
A good cover record means a team has been underpriced. It does not mean the team is good.
Those are different claims. A 10-3 ATS team has been consistently beating the market's expectation — which almost always means the market has since adjusted. The number you get this week is worse than the number people got in September. The very edge that produced the shiny record may be the thing that's now gone.
The reverse is just as true and far more useful. A team sitting 3-10 ATS is being priced by a market that has watched it fail repeatedly. That's exactly when a line gets soft in the other direction.
ATS is a starting point for a question, not the answer. Anyone selling you a betting system built on last season's cover records is selling you something.
Layer It With The Rest
The head-to-head book — every regular-season meeting since 2002: series record, home and road splits, and the average combined score to hold against tonight's posted total. Every rivalry is its own link now, so Cowboys-Giants or Broncos-Chiefs is one tap.
Per-game spot pages — every matchup on the schedule has its own page with the situational read and the series book on it.
The Red Zone Report — touchdowns per red-zone trip and trips per game, offense and defense, all ranked. This is a totals tool disguised as a stats page: a team with elite trips and mediocre scoring percentage is an under waiting to happen. They move the ball, they stall, they kick. Both boards run on defense too, so you can find the units that bend but genuinely don't break.
The Weather Book — 6,511 games joined to hourly stadium weather. A split only publishes if it holds across ten-plus games and sits twenty points off that team's own win rate, which kills the most common fake weather stat: a bad team losing in the cold. Wind moves a total further than temperature ever does.
Team stat sheets — offense and defense per game, ranked 1–32, going back three full seasons: 2025, 2024, 2023. Three years separates a defensive identity from one strange season.
Power rankings — where teams actually stand right now, and the board the spot engine reads when it computes a matchup gap.
From A Trend To An Actual Ticket
Found something you like? Now do the work that turns a trend into a bet.
The Line Checker tells you how many times a player has actually cleared any number you type, with the game log underneath. The props board prices every prop across nine books so you never take a worse number.
Then run whatever you build through the Parlay Doctor: it grades any slip A through F, shows the true break-even, exposes the juice, and flags correlated legs — the quiet way tickets die. Nothing you paste is stored.
Or let the AI parlay generator build it off a live odds engine across all four leagues. Everything's in Parlay Central.
And the graded ledger stamps every call we make the next morning, win or lose, with nothing quietly deleted. A site that only shows you winners never has to explain anything.
Open the ATS board → Free, no signup.
21+. If it stops being fun, 1-800-GAMBLER.