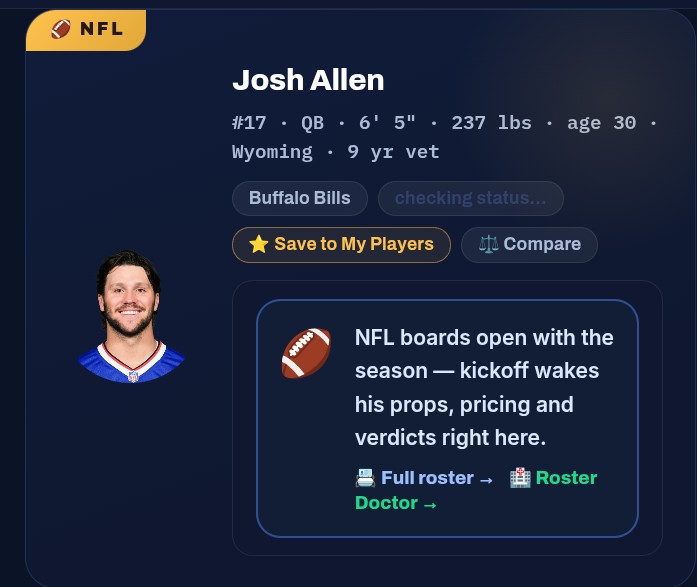
Josh Allen completed 78 percent of his passes short right last season.
He completed 28 percent deep right.
Same quarterback. Same season. Same arm. Two completely different throws, and if you only ever looked at his overall completion percentage — 63.7 — you'd never know either number existed.
That gap is the whole reason we built this. Every NFL player card on the site now carries a zone breakdown, and it answers a question season-long stats can't: where does this guy actually produce?
You can go look at Allen's card right now if you'd rather see it than read about it.
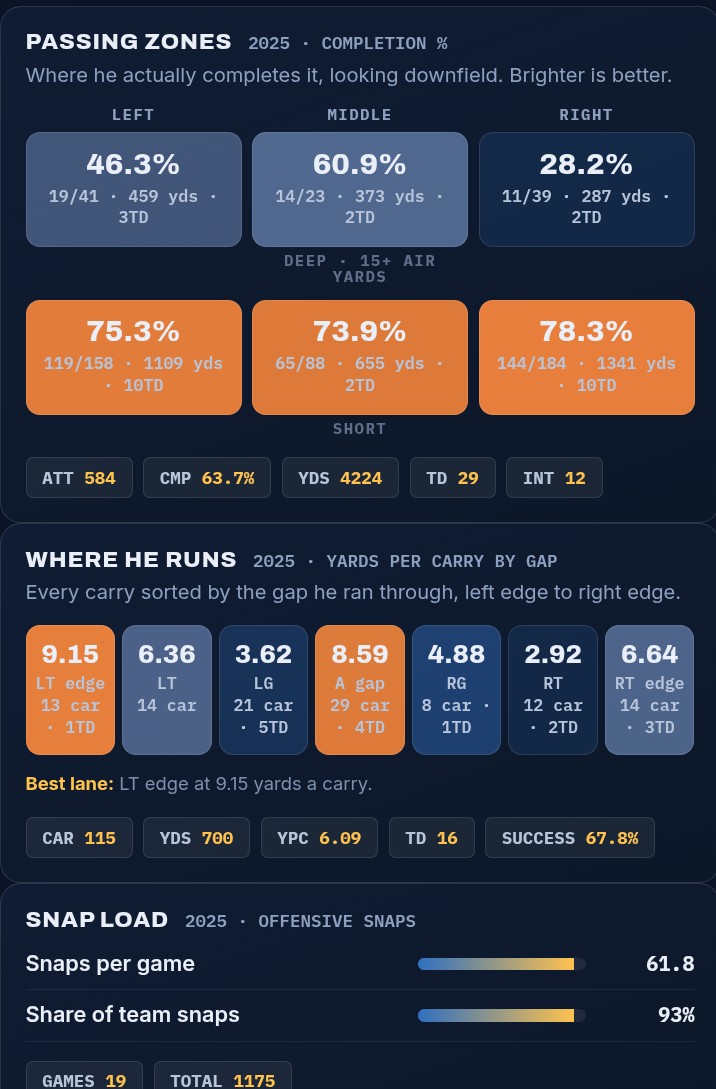
Quarterbacks: The Six-Zone Chart
The field in front of a quarterback divides into six pieces — short and deep, crossed with left, middle and right. Every pass he threw last season lands in one of them.
The chart shows completion percentage, attempts, yards and touchdowns for all six, heat-scaled to that specific quarterback's own range. Bright means he lives there. Dim means he doesn't, or he shouldn't.
What jumps out is how lopsided most quarterbacks are. The Allen split above isn't unusual — it's typical. Arms are not symmetrical, offenses are not symmetrical, and a passer who's lethal to one sideline is often ordinary to the other. Once you've seen a few of these charts you start reading matchups differently, because a cornerback who only ever plays one side is a much bigger problem for some quarterbacks than others.
Running Backs: Which Side Of The Line
This one is the most fun, and it's the question people ask constantly without any way to answer it.
Every carry gets sorted by the gap he actually ran through — left end, left tackle, left guard, up the middle, right guard, right tackle, right end. Seven lanes, laid out the way the line actually sits, with yards per carry and success rate for each.
Jahmyr Gibbs averaged 5.39 yards to the right edge with five touchdowns. Through the left guard: 4.23. Same back, same offense, same season. That's not noise, that's a scouting report — and it tells you something real about the blockers in front of him too.
One thing we deliberately fixed here: the chart reports success rate, not some meaningless completion percentage. A run is successful if it gains 40 percent of the yards needed on first down, 60 percent on second, or converts on third and fourth. That's the number that actually says whether a back is doing his job in a given lane, rather than whether he happened to break one long one.
Receivers: Target Zones And The Air/YAC Split
Receivers get the same six-zone treatment, but by catch rate — where he's targeted, and how often he brings it in from each area.
Ja'Marr Chase caught 78.8 percent of his short-left targets and 25 percent of his deep-left targets. That's a usable read for anyone setting a lineup or pricing a prop.
But the split underneath the chart might be the more valuable number: air yards versus yards after the catch.
Two receivers can post identical yardage and be entirely different players. One is winning downfield and doing the work before the ball arrives. The other is being schemed into space and doing the work after. That distinction matters enormously, because those two players react very differently to a quarterback change, a scheme change, or a defense that takes away the deep third.
Chase came in at roughly 55 percent air yards, 45 percent after the catch — a genuinely balanced profile. Plenty of receivers are far more lopsided than that, and the lopsided ones are where the mispricing lives.
Snap Counts, On Every Card
Opportunity beats talent in fantasy football. Every time. It isn't close.
So every card now carries offensive snaps per game and share of team snaps. A player on the field for 90 percent of his team's snaps has a floor. A player at 40 percent is a coin flip no matter how gifted he is, because he needs the touches to find him.
Snap share is also the earliest warning system in fantasy. Roles change quietly weeks before the box score notices — a back losing third downs, a receiver sliding out of three-wide sets. The snap count sees it first.
The Things We Won't Pretend About
Two caveats, printed on the cards themselves.
These charts describe the 2025 season. A player who has changed teams since is charted in his old offense. Kyler Murray's zones are Arizona's. James Conner's gaps are Arizona's too. That history is still informative — it tells you what a player did when given the chance — but it is not a projection, and treating it like one is how people get burned.
Thin samples are shown faded and never sold. If a receiver has nine deep-middle targets, that cell appears dimmed and it doesn't get to set the color scale. Nine targets is nine targets. It's a hint, not a fact, and we'd rather show you the number with the sample size attached than build a confident-looking chart on nothing.
Where To Find It
It's already on the cards. Pull up any NFL player and scroll — here's Ja'Marr Chase, or Josh Allen for the passing chart, or Jahmyr Gibbs for the run gaps.
Free, no signup, and it rebuilds every week during the season.
What To Pair It With
The zone chart tells you where a player works. These tell you the rest:
- Depth charts, all 32 teams — who is actually on the field
- Start or Sit — compare any two players on matchup, volume and form
- Boom or Bust — the range, because averages lie
- Consistency — who clears his line week after week
- Hot and Cold — recent form, not season-long noise
- The injury report — one inactive rewrites your whole build
- Camp Wire — every cut and signing as it happens
- The prop board — the market's own read on expected volume
For DFS
Zone data is at its most useful when you're building a lineup against a salary cap. DFS Edge grades every salary by projected points per $1,000. The AI lineup optimizer solves the cap off real DraftKings salaries with per-player locks and stacking. The Contest Lab handles the part most players skip — which contests to enter for your bankroll.
For Your League
Import your team from Yahoo, ESPN or Sleeper and every tool here works on your actual roster. Then the Roster Doctor grades every man you own, the Trade Analyzer stamps deals push, approved, overpay or veto, the Appraiser prices players for keeper and dynasty calls, and the Free Agent Wire flags the claims worth making.
Drafting soon? Draft Central, the 2026 Draft Guide, the Big Board, the December Board and the mock simulator are the five pages worth having open.
It all lives in one place: the NFL fantasy and DFS hub.